Diagrams In Hakyll!
I stumbled across this blogpost of Corentin
Dupont
where he put together a library that allows you to modify your hakyll blog so
that you can have inline diagrams! As anyone knows, this was amazingly
exciting to me, because I love
diagrams.
So I quickly tried to set it up; but, much to my sadness it didn’t immediately work.
Luckily, however, I was able to make it worked by hacking around in the two relevant repos:
The main result is a function, pandocCompilerDiagrams, that I included into
my hakyll site file like so:
match "posts/*" $ do
    route $ setExtension "html"
    compile $
            (pandocCompilerDiagrams "images/diagrams" <|> pandocMathCompiler)
        >>= loadAndApplyTemplate "templates/post.html"    postCtx
        >>= saveSnapshot "content"
        >>= loadAndApplyTemplate "templates/default.html" postCtx
        >>= relativizeUrls
And so now, I can have inline diagrams! Check it out:
Imagine we had a circle:

example = circle 1But now, what if the circle was repeated 5 times

example = hcat (take 5 $ repeat (circle 1))Cool!
To celebrate, let’s draw the Sierpinksi triangle:
The basic building block:

sierp d = d === (d ||| d) # centerXY
example = sierp (triangle 1)
Let’s go!

sierp d = d === (d ||| d) # centerXY
example = foldl (\d _ -> sierp d) (triangle 1) [1..3]
Colours!
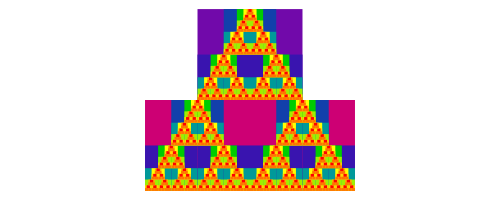
import Data.Colour.Palette.ColorSet

color n = rybColor (n*2)

sierp d n = d1 === (d2 ||| d2) # centerX
    where
        d1 = d # bg (color n)
        d2 = d # bg (color (n+1))

example = foldl step d0 [0..5]
    where
        d0       = triangle 1 # lw 0
        step d n = sierp d (n*2)
Happy days!